Ottantesima guida operativa Odoo 19 per PMI italiane, settima della serie di 15 guide sul CRM di Odoo. “Quanto venderemo questo trimestre?” è una delle domande più importanti per qualsiasi PMI italiana B2B. Una risposta vaga (“non lo so”, “speriamo bene”) significa niente pianificazione della produzione, decisioni di investimento al buio e flussi di cassa difficili da governare. Una previsione costruita sulla pipeline consente invece decisioni informate. In questa guida vediamo come usare Odoo CRM per ottenere previsioni affidabili: dalla probabilità della singola opportunità alla previsione ponderata complessiva, con un metodo per migliorarne l’accuratezza nel tempo.
Vediamo: che cos’è una previsione accurata, la probabilità di ogni opportunità, la previsione ponderata, la disciplina sulla data di chiusura prevista, il cruscotto per la direzione, la misura dell’accuratezza ed esempi illustrativi per PMI italiane.
Che cos’è una previsione accurata
Definizione
- Stima realistica dei ricavi del periodo successivo (mese, trimestre, anno)
- Basata sulla pipeline reale e sulle probabilità
- Aggiornata con continuità
- Accuratezza misurabile (previsto rispetto a consuntivo)
Obiettivi di accuratezza
- Sul mese in corso la previsione deve essere la più precisa
- Sul trimestre è normale uno scarto maggiore
- Oltre i 90 giorni la previsione indica soprattutto la tendenza
- Le tolleranze accettabili vanno fissate internamente e verificate sullo storico
Benefici per l’azienda
- Pianificazione della produzione più affidabile
- Gestione dei flussi di cassa
- Decisioni sulle assunzioni basate sui dati
- Maggiore credibilità verso soci, banche e investitori
- Affiancamento mirato dei venditori
Opportunità e ricavo atteso
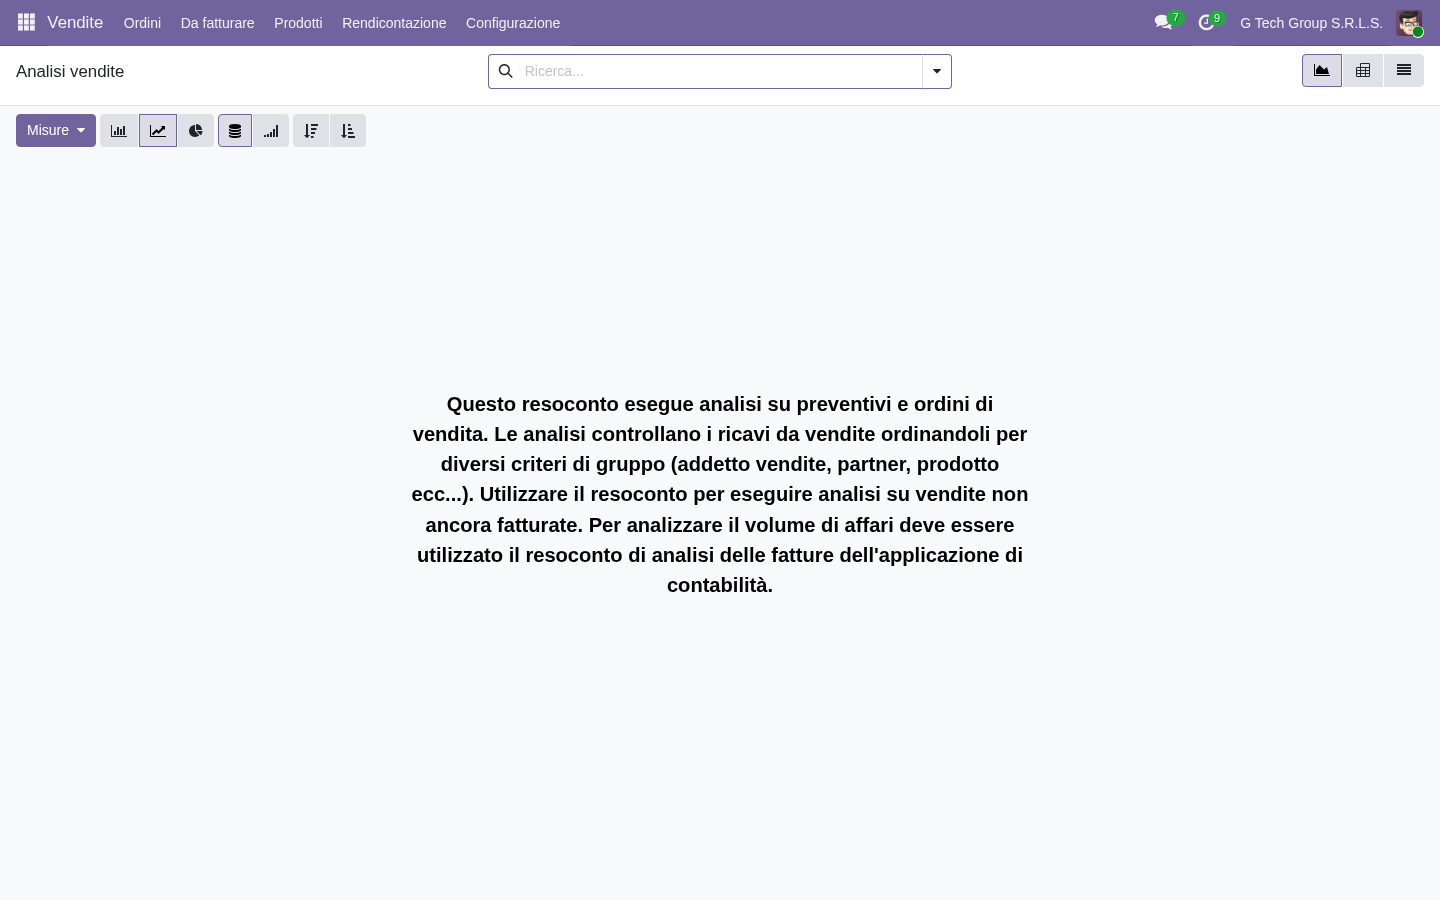
Ogni opportunità in Odoo ha il campo “Ricavo atteso”: quanto il venditore pensa di incassare dalla trattativa. Combinato con la probabilità, alimenta la previsione. La qualità di questo dato è il fondamento di tutto:
- Ricavo atteso: valore della trattativa
- Inserito dal venditore (i preventivi collegati sono consultabili dall’opportunità, ma non aggiornano il campo in automatico)
- Ricavo ricorrente (canoni) gestibile in un campo dedicato
- Scenari migliore/peggiore solo con campi personalizzati
- Usato nella previsione ponderata
- Confrontato con l’importo effettivo alla chiusura
Probabilità di ogni opportunità
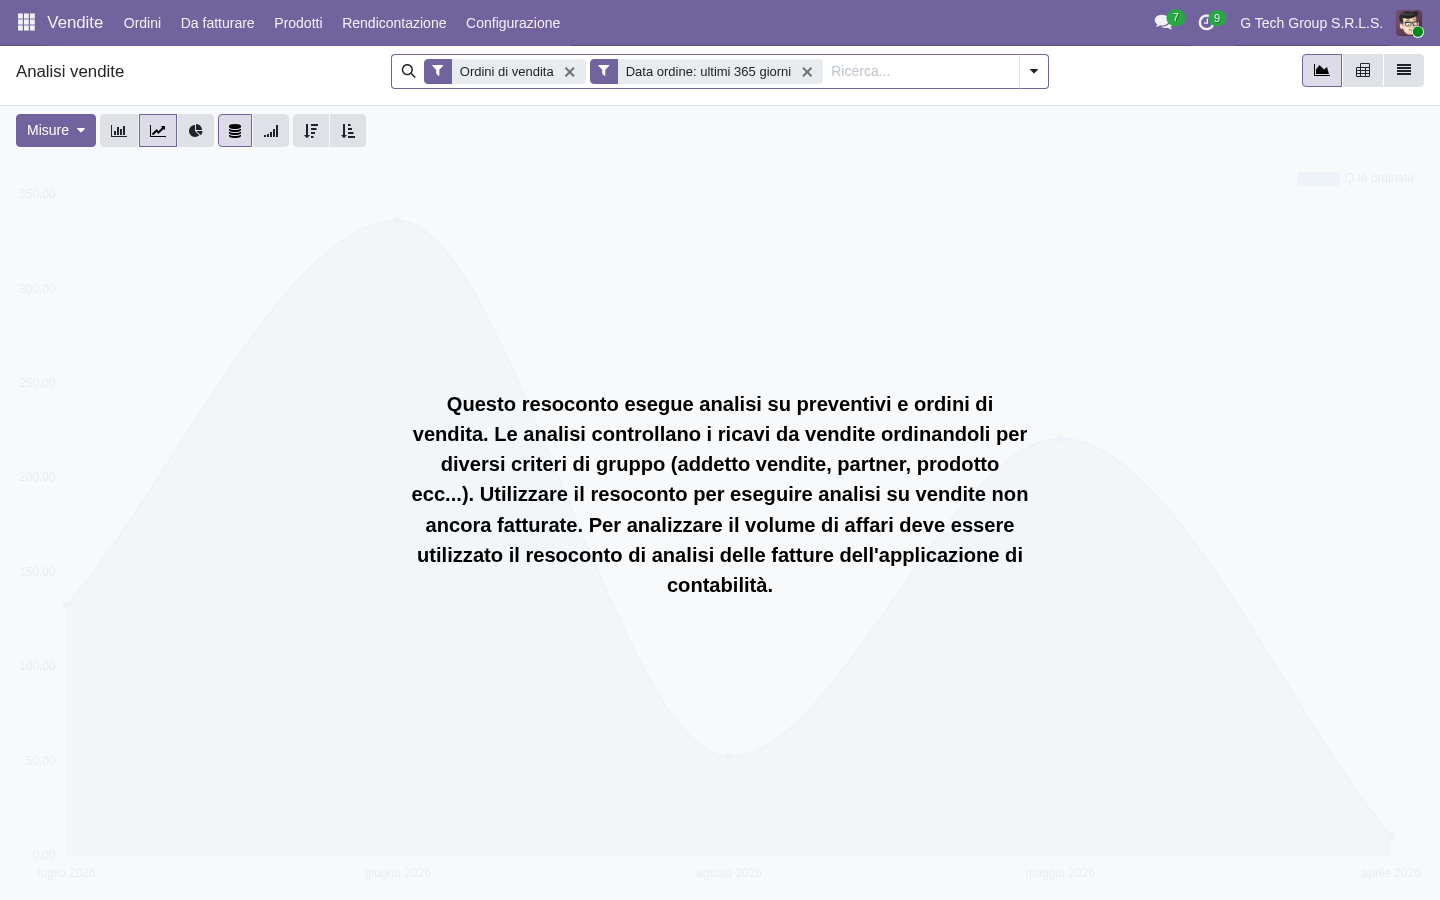
La probabilità è la percentuale di chiusura prevista. Nelle versioni recenti (incluse 17-19) Odoo non la ricava più dalla fase della pipeline: la calcola il punteggio predittivo sullo storico di trattative vinte e perse (vedi guida 6). Il venditore può sovrascriverla a mano e riportarla al valore calcolato con un clic. Un’opportunità vinta passa al 100%, una persa allo 0% e viene archiviata:
- Campo probabilità da 0 a 100%
- Valore calcolato dal punteggio predittivo
- Correzione manuale possibile
- 100% automatico quando l’opportunità è vinta
- 0% automatico quando è persa
- Base del calcolo ponderato
Scala indicativa per la correzione manuale
- 10-20%: lead qualificato, nessun impegno
- 25-40%: analisi delle esigenze completata
- 50-60%: offerta inviata, nessuna obiezione
- 70-80%: impegno verbale del cliente
- 90%: contratto in attesa di firma
- 100%: vinta
Previsione ponderata
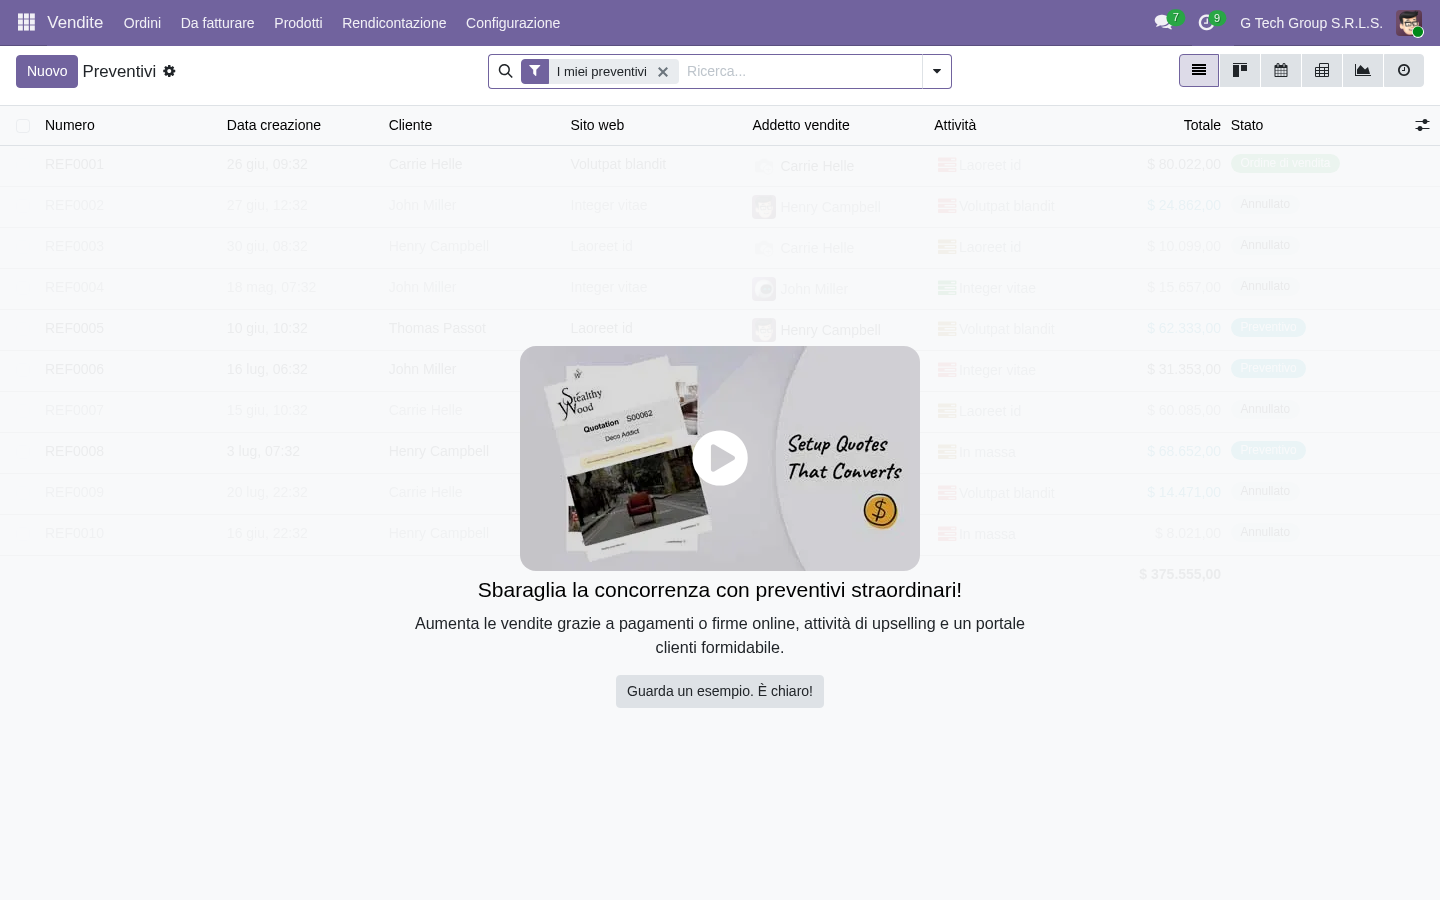
La previsione ponderata è la somma, per ogni opportunità, di ricavo atteso × probabilità. È più realistica sia dello scenario migliore sia di quello peggiore e per la direzione è l’indicatore chiave (KPI, Key Performance Indicator):
- Formula: Σ(ricavo atteso × probabilità)
- Calcolata da Odoo nel campo “ricavo ripartito”
- Visibile su ogni opportunità
- Aggregabile per team, periodo e venditore
- Rendiconto “Previsione” del CRM, raggruppato per mese di chiusura prevista
- Confronto con l’obiettivo di fatturazione del team
Esempio di calcolo
- Opportunità A: 50.000 € × 25% = 12.500 €
- Opportunità B: 30.000 € × 60% = 18.000 €
- Opportunità C: 80.000 € × 90% = 72.000 €
- Opportunità D: 20.000 € × 10% = 2.000 €
- Totale ponderato: 104.500 €
- Scenario migliore (tutte vinte): 180.000 €
- Scenario peggiore (solo quelle al 90% o più): 80.000 €
Disciplina sulla data di chiusura prevista
La data di chiusura prevista è decisiva per attribuire la previsione al periodo giusto. Senza disciplina le opportunità si accumulano tutte su “questo mese” e la previsione si gonfia. In Odoo il filtro sulle opportunità scadute e le azioni automatizzate aiutano a individuare le date superate:
- Campo da rendere obbligatorio per regola interna (o con una personalizzazione)
- Da aggiornare quando slitta, mai lasciarlo superato
- Avviso se la data è passata senza avanzamenti
- Guida per la pianificazione delle attività
- Collocazione della trattativa nel periodo corretto
- Spunto di affiancamento se un venditore la fa slittare spesso
Gestione degli slittamenti
- Segnalazione automatica delle opportunità con data superata
- Obbligo di nuova stima con data futura
- Conteggio degli slittamenti per opportunità (campo personalizzato)
- Tre o più slittamenti sono un campanello d’allarme
- Analisi delle ricorrenze per l’affiancamento
Cruscotto commerciale per la direzione
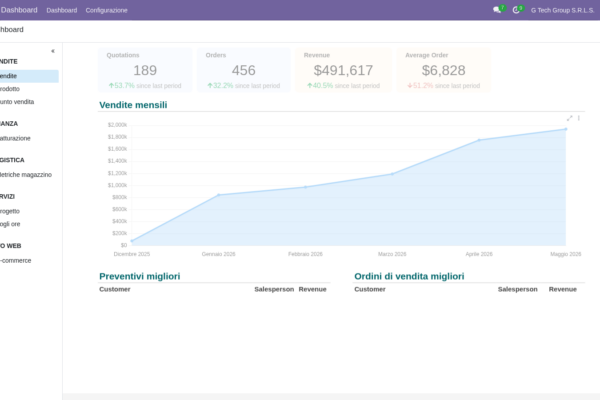
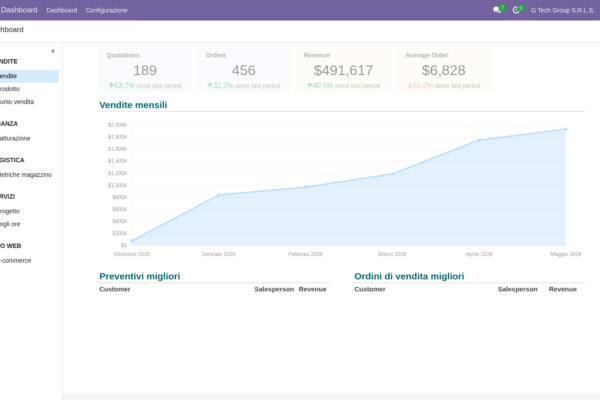
Il cruscotto per la direzione riunisce gli indicatori principali: pipeline, previsione ponderata, scostamento dall’obiettivo, tasso di successo, valore medio delle trattative. I dati sono sempre aggiornati e titolare, direttore finanziario e responsabile commerciale guardano lo stesso numero. In Community si usano le viste pivot e grafico del CRM; in Enterprise anche i cruscotti su fogli di calcolo:
- Pipeline complessiva (valore pieno e ponderato)
- Previsione per periodo (mese, trimestre, anno)
- Scostamento dall’obiettivo
- Andamento del tasso di successo
- Valore medio delle trattative
- Durata media del ciclo di vendita
- Dettaglio per team e venditore
Tipi di previsione
Previsione sulla pipeline
- Solo opportunità già presenti nel CRM
- Ponderata con le probabilità
- La più affidabile nel breve periodo
- Sottostima il nuovo business non ancora in pipeline
Previsione sugli impegni dei venditori
- Costruita dal basso, partendo dagli obiettivi individuali
- Ogni venditore si impegna su un numero
- Di solito prudente
- Influenzata dalla pressione sugli obiettivi
Previsione statistica
- Serie storiche delle vendite
- Stagionalità e tendenza
- Visione di lungo periodo (12 mesi e oltre)
- Considera il quadro economico generale
- Non nativa in Odoo: si elabora su fogli di calcolo o strumenti esterni
Previsione mista (la più completa)
- Pipeline per i prossimi 90 giorni
- Statistica oltre i 90 giorni
- Correzione finale della direzione
- Confronto incrociato delle tre fonti
Migliorare l’accuratezza
Misurare
- Confronto mensile tra previsto e consuntivo
- Scarto percentuale per periodo
- Analisi per venditore e per team
- Andamento nel tempo
Riconoscere le distorsioni
- Previsione prudente per eccesso (sandbagging): si prevede poco per poi superare l’obiettivo
- Previsione ottimista per eccesso: si prevede molto e si chiude meno
- Tendenze ricorrenti di singoli venditori
- Tendenze ricorrenti di singole fasi
Riunioni di taratura
- Revisione settimanale della previsione
- Il responsabile commerciale mette in discussione le stime
- Taratura delle probabilità
- Motivazioni documentate
Miglioramento continuo
- Analisi delle trattative vinte e perse
- Revisione delle variabili del punteggio predittivo
- Affinamento del processo
- Formazione basata sulle ricorrenze osservate
Errori comuni
“Probabilità ignorata”
Problema: la previsione è la semplice somma dei ricavi attesi, senza ponderazione.
Soluzione: previsione ponderata obbligatoria, mostrata accanto allo scenario migliore.
“Date di chiusura superate”
Problema: un’opportunità indica “la settimana prossima” da tre mesi, mai aggiornata.
Soluzione: avviso automatico sulle date passate e obbligo di aggiornamento.
“Accuratezza mai misurata”
Problema: la previsione viene fatta ma mai confrontata con il consuntivo.
Soluzione: revisione mensile dell’accuratezza.
“Cultura della previsione prudente”
Problema: i venditori prevedono sistematicamente meno del reale per superare facilmente l’obiettivo.
Soluzione: incentivi coerenti e verifica delle stime da parte del responsabile.
“Un solo numero”
Problema: solo la previsione ponderata, senza scenari.
Soluzione: presentare scenario peggiore, probabile e migliore.
Esempi illustrativi per PMI italiane
Esempio 1 — Software: previsione sulla pipeline
- Previsione sulla pipeline a 30, 60 e 90 giorni
- Previsione ponderata complessiva
- Confronto mensile con il consuntivo
- Comunicazione più chiara verso soci e investitori
Esempio 2 — Manifattura B2B: previsione mista
- Pipeline più modello di stagionalità
- Considerato il ciclo di vendita lungo
- Previsione trimestrale
- Pianificazione della produzione allineata alle vendite
Esempio 3 — Servizi: impegni dei venditori
- I venditori si impegnano su un obiettivo
- Il responsabile verifica le stime
- La pipeline deve sostenere l’impegno dichiarato
- Tasso di successo monitorato nel tempo
Esempio 4 — E-commerce B2B: peso sulla statistica
- Volumi sufficienti per un modello statistico
- Stagionalità rilevante
- Pipeline usata come verifica
- Previsione mensile con controllo settimanale
Domande frequenti
Quanto deve essere accurata la previsione?
Più l’orizzonte è vicino, più la previsione deve essere precisa: sul mese in corso lo scarto deve essere contenuto, oltre i 90 giorni conta soprattutto la tendenza. Le soglie vanno fissate sullo storico aziendale. Scarti ampi e ricorrenti segnalano problemi di qualifica o di disciplina; una previsione sempre superata può invece nascondere stime volutamente prudenti.
I venditori devono vedere la previsione ponderata?
Sì, la trasparenza aiuta: i venditori capiscono meglio pressioni e dinamiche e stabiliscono meglio le priorità sulle proprie opportunità. Il responsabile commerciale si concentra sulla vista d’insieme.
Si può fare previsione con il solo CRM, senza l’app Vendite?
Sì, il CRM da solo produce la previsione. L’integrazione con Vendite e Fatturazione aggiunge i ricavi effettivi per confrontare previsto e consuntivo.
Ogni quanto aggiornare la previsione?
Sulla pipeline il dato si aggiorna in automatico. Revisione con la direzione: settimanale. Correzioni strategiche: mensili. Revisione generale: trimestrale.
Scenario migliore o previsione ponderata?
La ponderata serve per una pianificazione realistica, lo scenario migliore per gli obiettivi sfidanti, quello peggiore per la gestione del rischio. Alla direzione servono tutti e tre.
Prossimi passi
Nella prossima guida (8 di 15 della serie CRM) vedremo integrazione email e modelli: configurazione dell’invio, libreria di modelli, stampa unione, tracciamento di aperture e clic e accorgimenti per la produttività.
Vuoi previsioni di vendita più affidabili nella tua PMI?
I consulenti certificati Odoo di BrentaSoft aiutano le PMI italiane a impostare in Odoo CRM la taratura delle probabilità, la previsione ponderata, il cruscotto per la direzione e la misura periodica dell’accuratezza.
Prenota una call conoscitiva oppure prova la nostra demo Odoo 19 online. Oppure prova Odoo direttamente su odoo.com (link referral di BrentaSoft).
Vuoi una soluzione su misura per la tua azienda?
Brentasoft sviluppa gestionali, CRM e software personalizzati per PMI italiane. Parliamo del tuo progetto.